Interactive Tools and Decision Support for Climate Action
We build the tools that turn model results into something people can actually use: explorative web applications, decision support systems for regions and municipalities, and calculators that let non-specialists work through scenarios themselves. We take on the whole path: the requirements process with the people who will use the tool, the interaction concept, the interface, and the back end that connects it to the scientific model.
Climate Media Factory grew out of a climate institute and a film school. It was founded in 2011 as a spin-off of the Potsdam Institute for Climate Impact Research (Potsdam-Institut für Klimafolgenforschung) and the Film University Babelsberg Konrad Wolf, and scientists and media professionals have worked on the same content here ever since. In tool development that matters more than anywhere else. An interface that lets a model say more than it can say is worse than no interface, and recognising where that line runs takes someone who understands the model.
What we deliver
Requirements and co-creation with the people who will use the tool. Stakeholder workshops at the start, prototypes early, user tests with the actual target group rather than with the consortium.
Interaction concept and interface design. What the tool lets someone do, in what order, and what it refuses to let them conclude.
Front-end development. The working application, built for the devices the target group has, not only for a desk.
Back end, data interfaces and model integration. The connection to the scientific model, the data structures behind the interface, and the interfaces other systems need in order to use the results.
Launch, hand-over and, where that is what you want, continued operation. Some tools move to the client's own infrastructure at the end of the project. Others stay with us. We settle that per project.
How we work
We start with the people who will use it. A workshop that establishes who uses the tool for what purpose, and what they need in front of them at the moment they decide. Not a feature list.
Prototypes before development. Something clickable early, tested with the target group, so the expensive part is built on an answered question.
Model integration and societal readiness. We work with the modelling team on what the tool may present and what it may not. This is where most of the scientific argument happens, and it belongs before the interface is fixed, not after. Bringing the needs of users and stakeholders into that argument early often leads to model assumptions being revised, additional drivers being taken into account, or the model's focus shifting, and in the end to output that answers socially relevant questions better. In this sense our work supports the research itself: it raises the societal readiness of the results, which is what Horizon Europe now asks of projects in its climate, energy and mobility calls, and it is where social science and humanities perspectives enter a technical project in practice.
Launch and hand-over. The application, its documentation, and a decision about who runs it afterwards.
What we need from you. The model or the data, someone from the modelling team who is reachable, access to the people the tool is for, and the willingness to set aside scientific jargon and the wish for completeness in favour of accessibility and relevance.
Selected work
LOCALISED Climate Action Strategiser
Horizon 2020 (2021–2025)
We developed one of the project's main products, the Climate Action Strategiser, and built its back end. We also developed and implemented the stakeholder engagement strategy that anchored the tool in a co-creative process.
The Strategiser gives local and regional governments emission reduction and adaptation pathways for their own area, down to NUTS3 and LAU level and in their native languages, aligned with national decarbonisation trajectories and designed to feed directly into a Sustainable Energy and Climate Action Plan. A municipality uploads no data of its own: the pathways are computed from downscaled national trajectories.
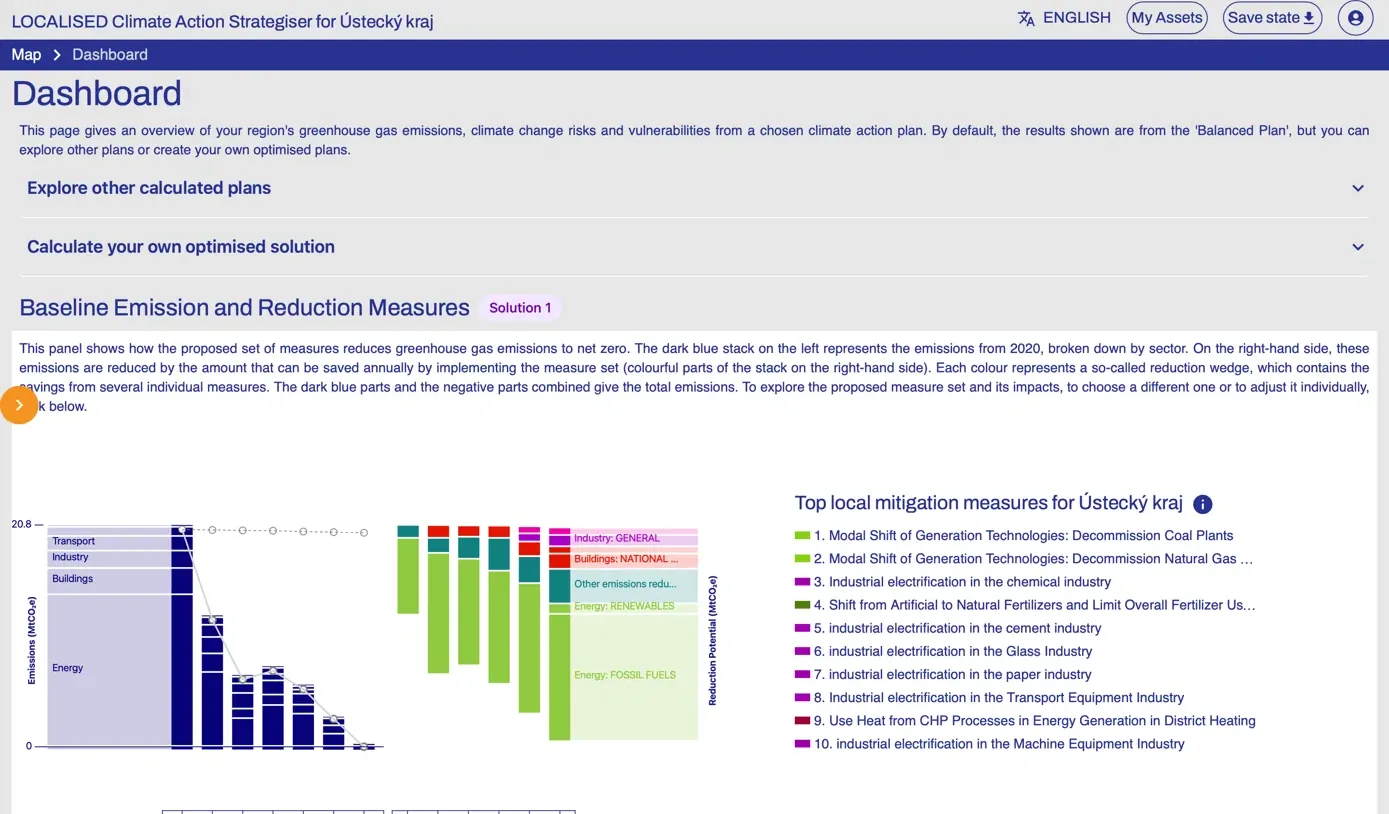 The Strategiser for Ústecký kraj. We still run the tool on our own infrastructure
The European Environment Agency has since taken the Strategiser into Climate-ADAPT, the European climate adaptation platform it runs together with the European Commission. It is listed there in the catalogue of climate resilience tools recommended to national and subnational authorities across Europe, covering all six steps of the adaptation policy cycle, available in every EU language.
→ LOCALISED Climate Action Strategiser Tool (CAST)
→ The Strategiser on Climate-ADAPT
My2050 and the MacKay Carbon Calculator
UK government, Belgian federal government
In the My Europe in 2050 web application, complex project datasets became an interface that lets people explore different pathways to net zero in Europe. We then developed that result further into calculators for different purposes. The MacKay Carbon Calculator was built for the tenth anniversary of the UK 2050 Calculator and launched at COP26 in Glasgow; it is used in education and in professional practice and runs on a UK government domain.
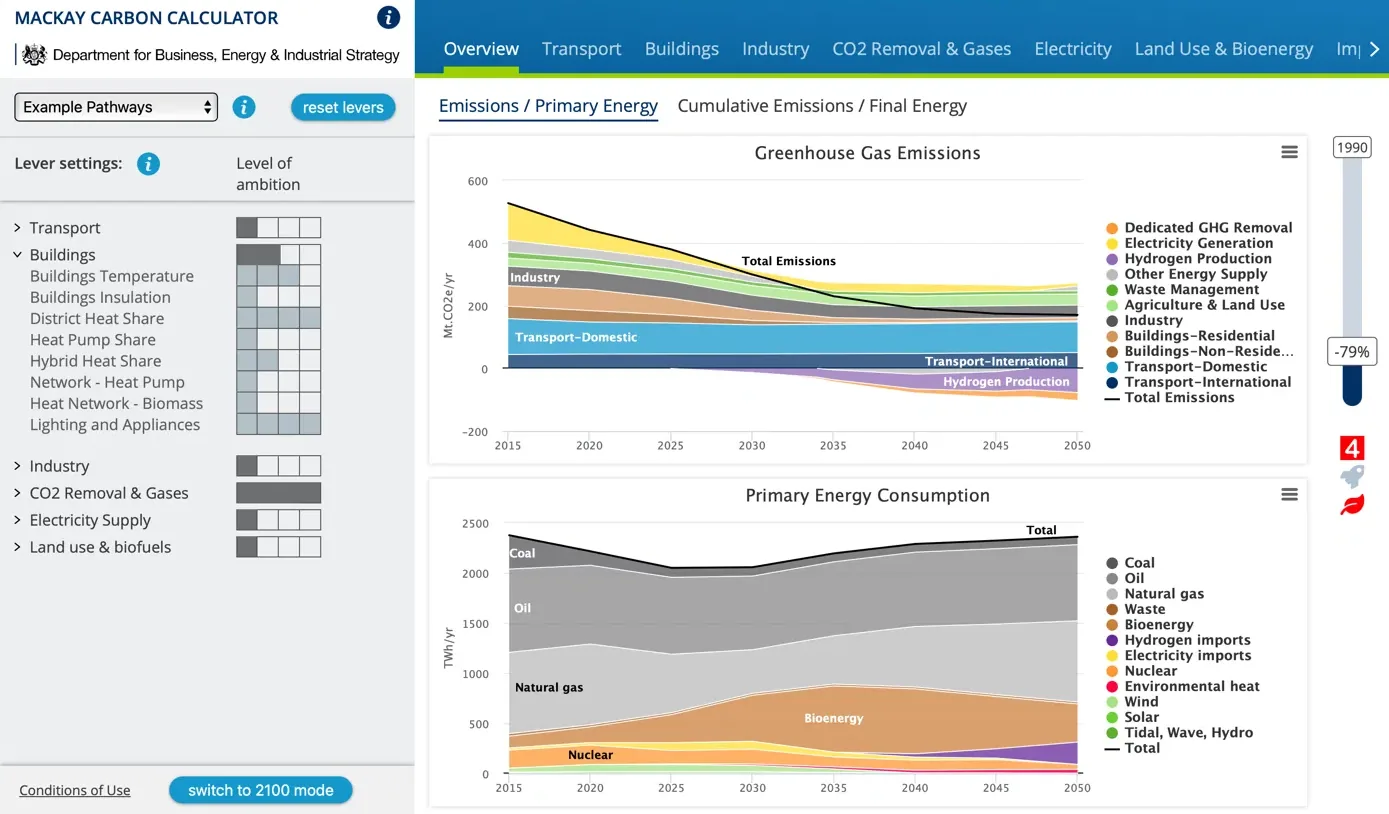 Ambition levers on the left, the consequences on the right, recalculated as you move them
A further version, My Belgium in 2050, was made for Belgian schools with the support of the Belgian FPS Public Health, Food Chain Safety and Environment.
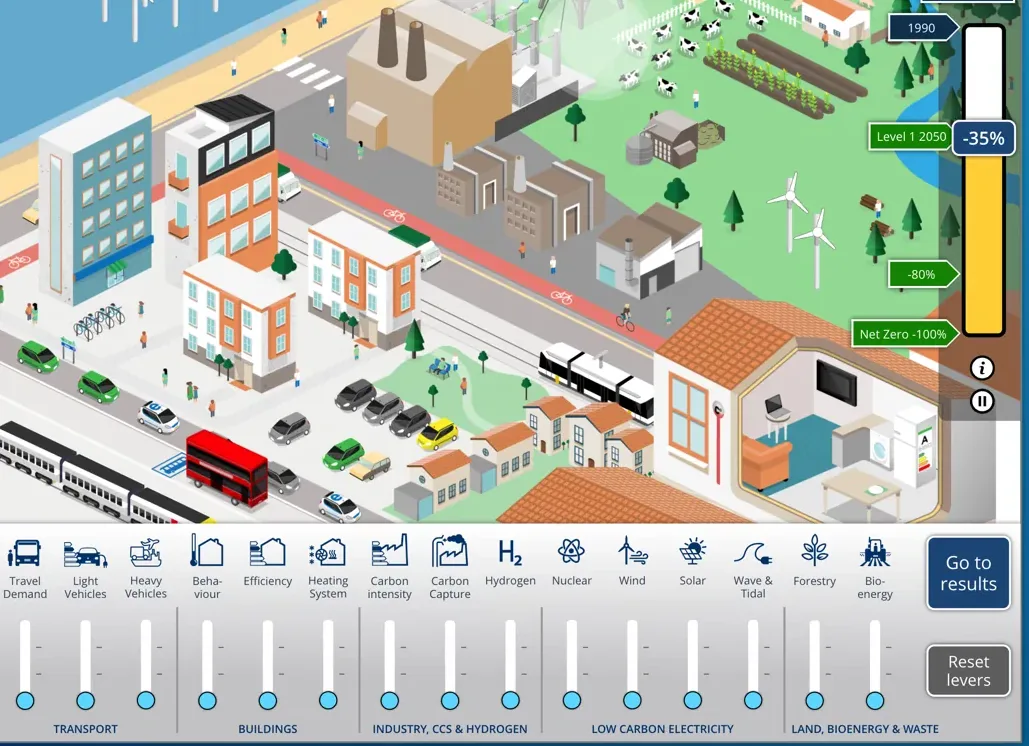 The same model, built for a classroom: every lever changes the picture
→ My2050 & MacKay Carbon Calculator
EUCalc Transition Pathways Explorer
Horizon 2020 (2016–2020)
In a consortium of thirteen organisations, among them Imperial College London, IIASA, the Tyndall Centre, the London School of Economics and BOKU Vienna, we built the interface for the project's final model. The Explorer lets a user take a European share of the global emissions budget, explore the ambition levels that follow across all sectors and member states, design a pathway of their own and see its consequences, trade-offs and synergies.
→ EUCalc – Transitions Pathways Explorer
Also in this area
The Climate Vulnerability Monitor biophysical data explorer, whose visual interface we built for the Climate Vulnerable Forum and which Bernd Hezel presented at COP27.
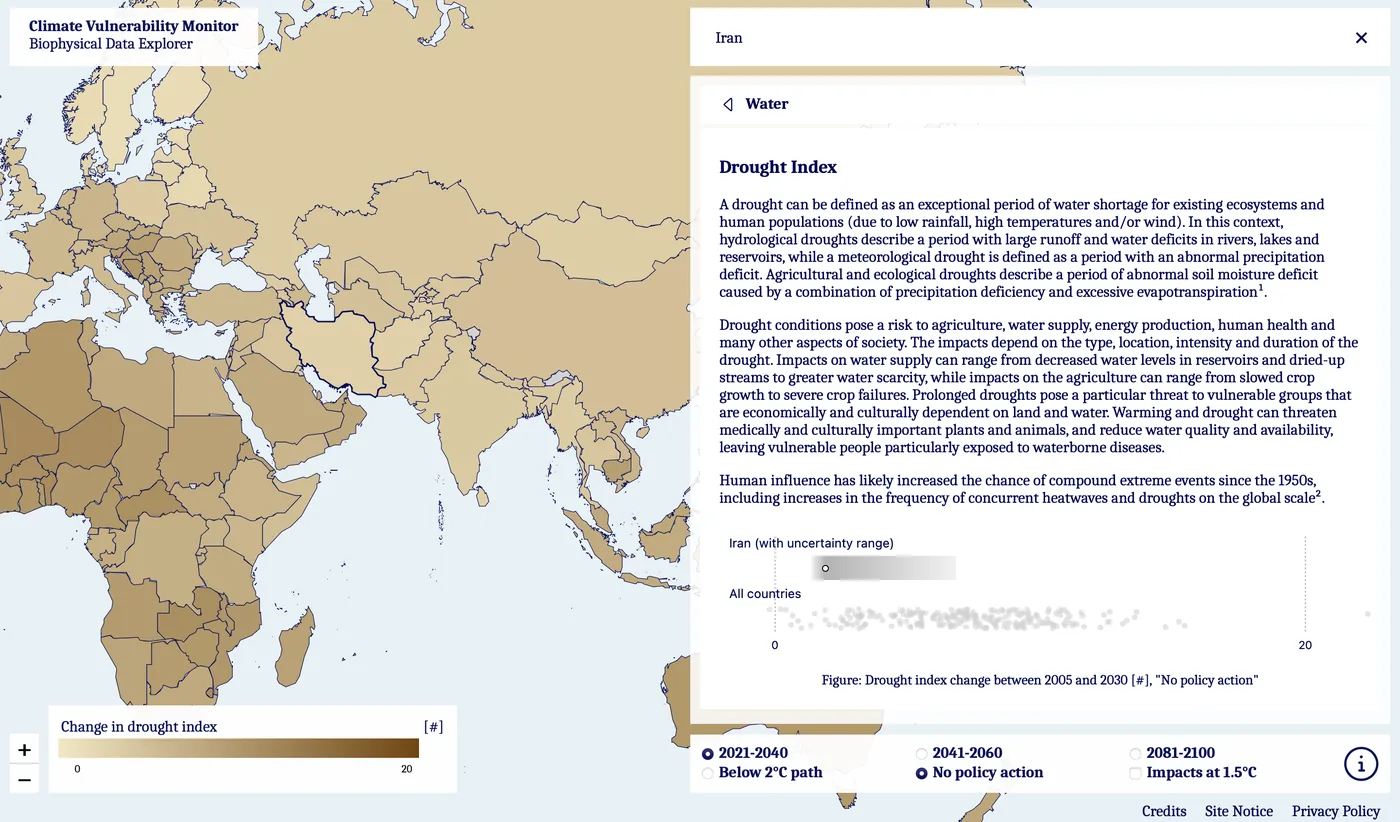 A world map of biophysical indicators, with the science behind each one a click away
The STEEP-CarbonTrans tool, an interactive flow diagram on the transition of the chemical and waste industries, built for the Chair of Decarbonization and Transformation of Industry at BTU Cottbus with TU Bergakademie Freiberg.
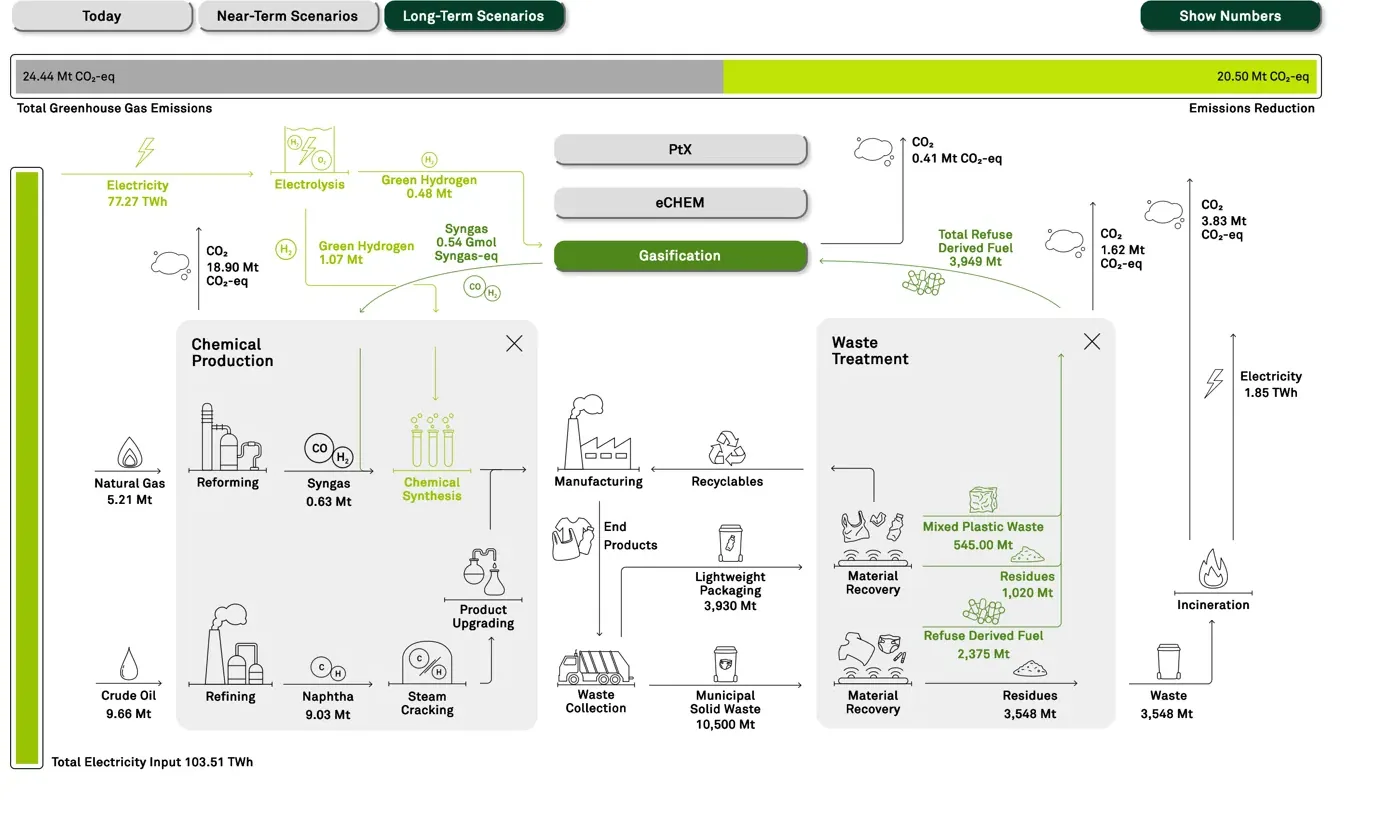 Material and carbon flows through two industries, in one picture
Who we work with
Research consortia in Horizon Europe and Horizon 2020; ministries and government departments, among them the UK government and the Belgian federal government; the UK government's international 2050 Calculator work, which commissioned us to share our calculator expertise with the teams building national calculators in other countries; municipalities and regional authorities; universities, among them BTU Cottbus and TU Bergakademie Freiberg; and international bodies such as the Climate Vulnerable Forum.
Who leads this work
Dr. Bernd Hezel, CEO. Physicist, formerly researcher at the Potsdam Institute for Climate Impact Research. He leads the work on concept, model architecture and integration on these projects and is the person to talk to.
Frequently asked questions
What do you need from us to start: finished model results, raw data, or just a research question?
Any of the three, but they lead to different projects. With finished results we can go straight into the interaction concept. With raw data or an open question there is a step before that, in which we work out with you what the tool can responsibly say.
Can you join the project as a partner, or do you work on commission?
Both. We have built tools as a beneficiary inside a consortium, as in LOCALISED and EUCalc, and on direct commission, as for the UK government and for BTU Cottbus.
Can you cover the societal readiness requirements of a Horizon Europe call?
Yes. Early stakeholder engagement, user requirements, co-creation and the assessment of how results will actually be taken up are the first steps of every tool we build, and we document them in the form a work package and its deliverables need.
Can people use the tools without being specialists?
That is what they are for. The Climate Action Strategiser asks a municipality to upload no data of its own, because the pathways are computed from national trajectories. My2050 is used in schools.
Which languages can a tool be delivered in?
We work in German and English as a matter of course. Beyond that it is a question of the project: the Climate Action Strategiser was built so that it can be adapted to local languages, and a Belgian version of the my2050 calculator was made for schools there.
Who runs the tool after the project ends?
We settle that per project. Some tools move to the client's own infrastructure at hand-over, others stay with us, whichever suits you best.
Cases in this area


Talk to Bernd Hezel about your tool: hezel@climatemedia.de

